AscendAccuRate rates come from millions of historical AND future real, live, actual AscendTMS loads on the lane you are querying based on over 42,000 origin/destination US postal codes. You're seeing the average "all-in" price paid to the actual truck to move the load.
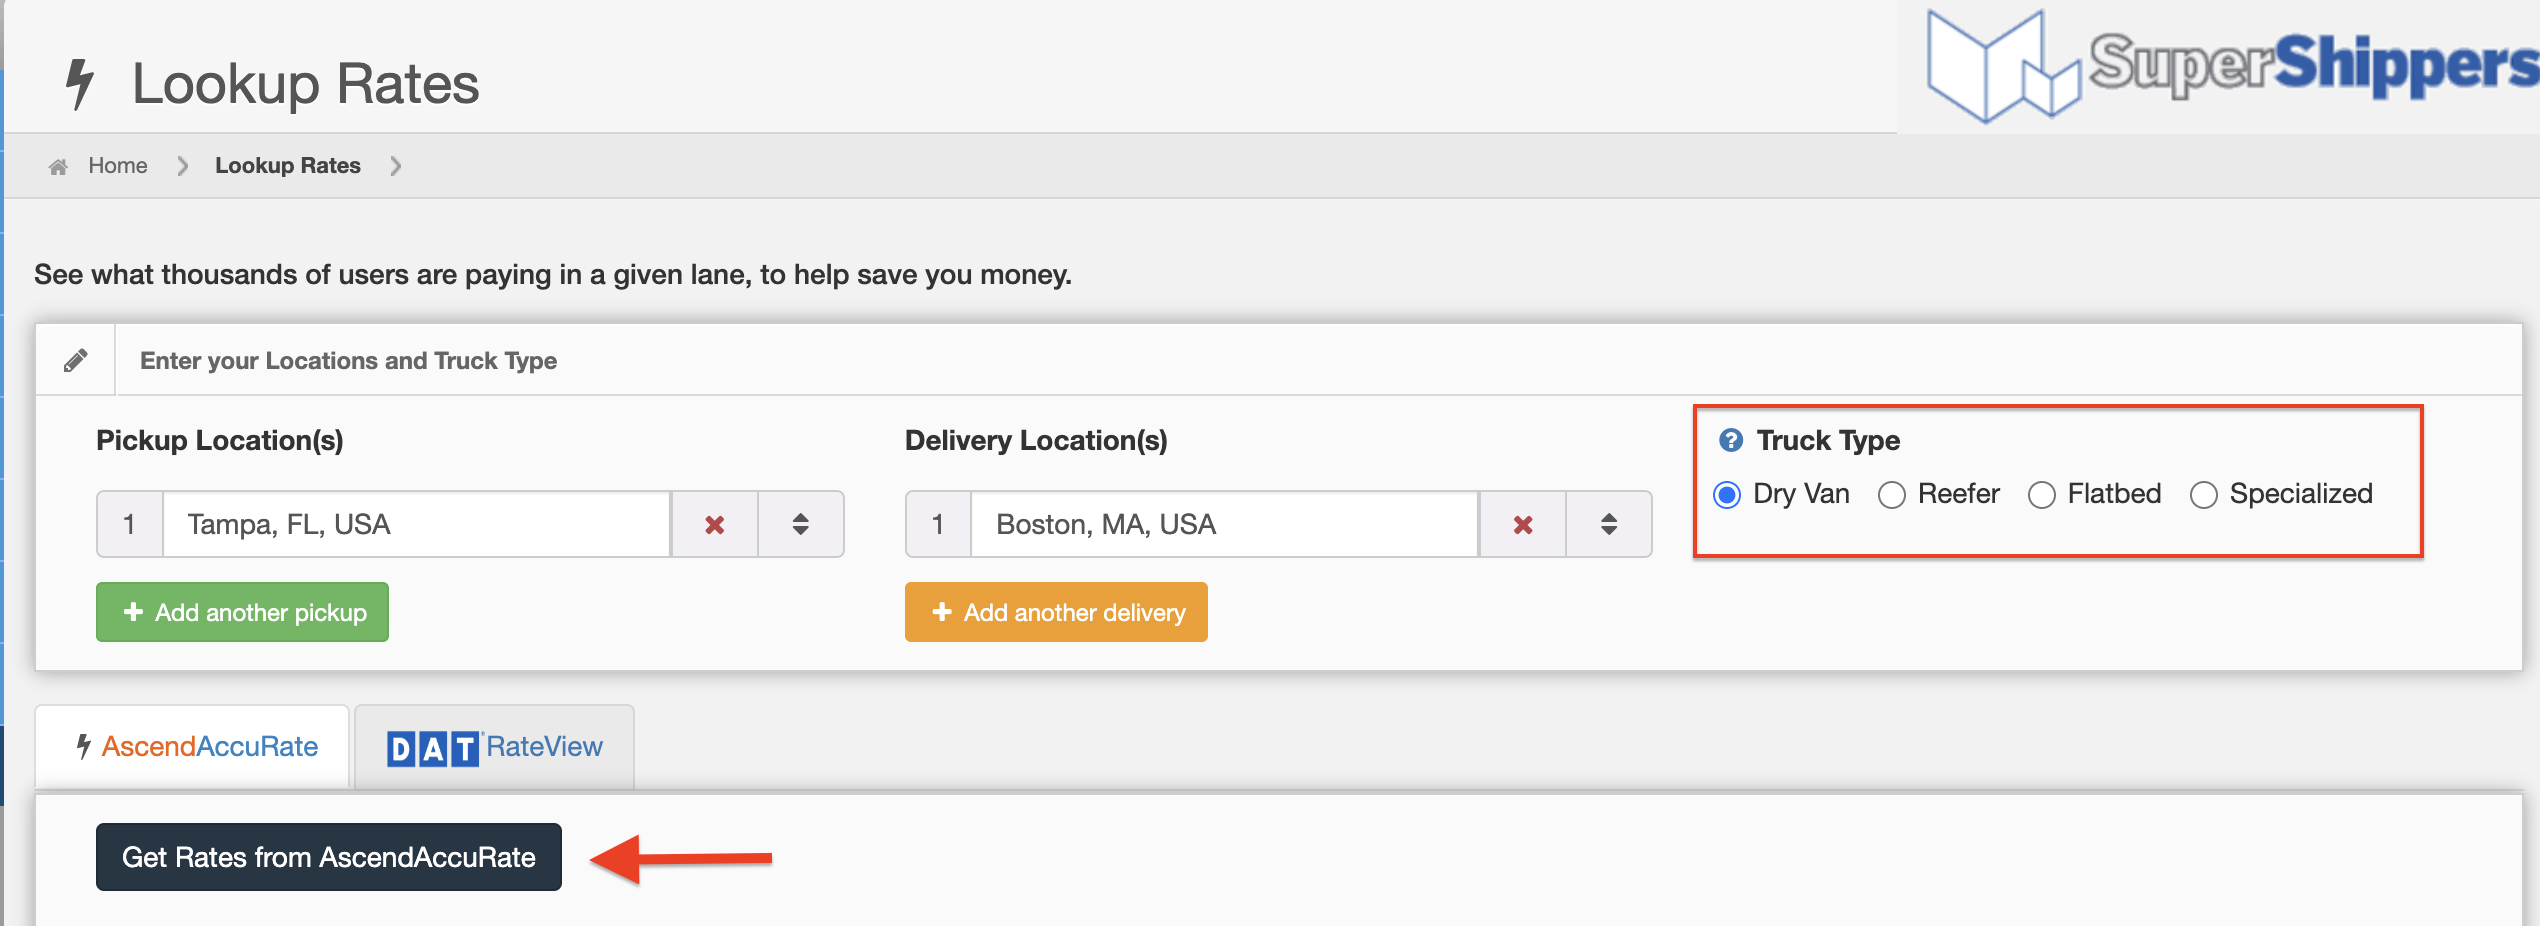
To get started, enter your pickup location(s), your delivery location(s), and select a truck type Dry Van, Reefer, Flatbed, or Specialized. Then just click on the “Get Rates from AscendAccuRates"button.
AscendAccuRate gathers the rates and shows you the High, Low, and Median rates for the past 90, 30, and 15 days. AscendAccuRate also shows you what the rate will be for the next 7 days into the future, from actually booked loads! The rates are displayed as "Rate per Mile" as well as "Total Cost of Load". All rates are the "All-in Rate" which includes fuel, accessorials, etc. AscendAccuRate also displays whether the rates have been trending up or down in a given market with up and down arrows.

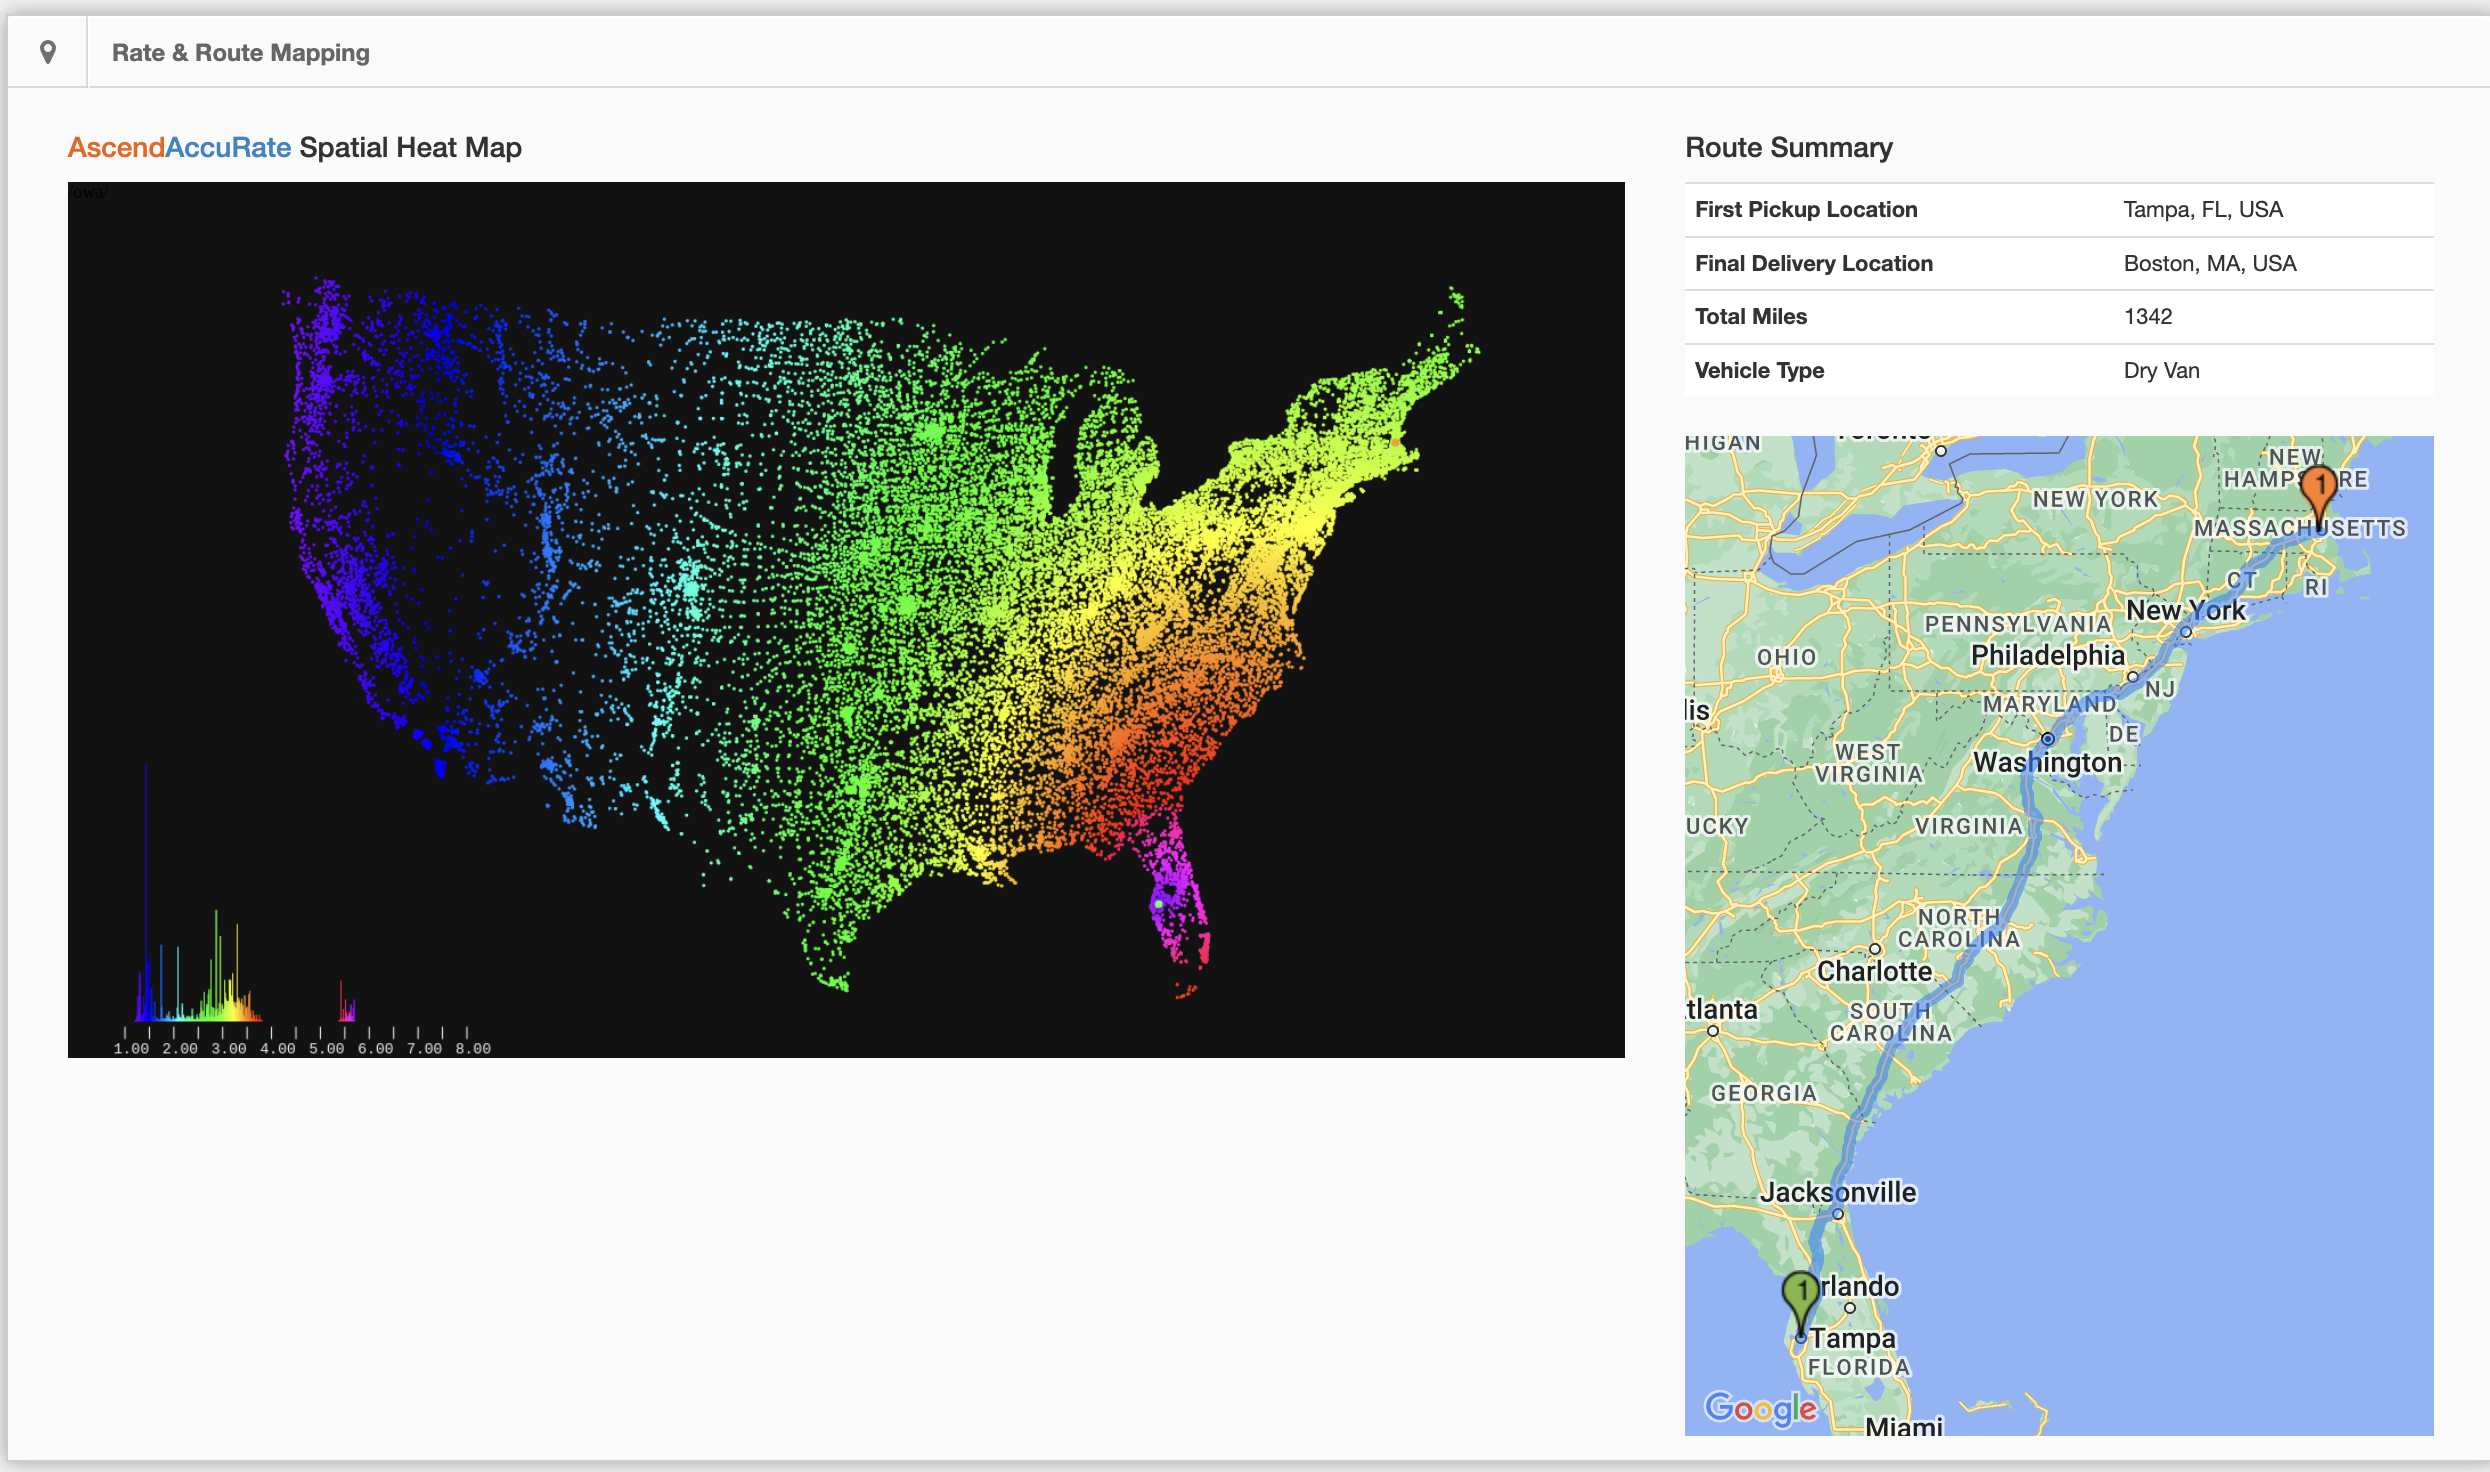
If you scroll down you will find the Route Summary as well as the AscendAccuRate Spatial Heat Map. The heat map displays the density of the lane rates in America as well as the "All-in Rate Per Mile" from highest to lowest according to the origin you selected above. In the example below, you will see that the rates that are closer to the point of origin (Tampa, FL) are purple. This indicates that the rate per mile close to Tampa are higher. As you move away from Tampa, the colors turn to red, yellow, greeen, aqua, and blue wich shows the rate-per-mile decreasing as those colors change. This comes in handy if the rates in a certain destination area, let's say Chicago, start rising for loads originating in Tampa, that area will show that by displaying a color of yellow, orange, red, or purple. (Blue is the lowest price, then aqua, then green, then yellow, then orange, then red, then purple.)
Chris
Comments